
Visualizing Pandas' Pivoting and Reshaping Functions
I love using python’s Pandas package for data analysis. The 10 Minutes to pandas is a great place to start learning how to use it for data analysis.
Things get a lot more interesting once you’re comfortable with the fundamentals and start with Reshaping and Pivot Tables. That guide shows some of the more interesting functions of reshaping data. Below are some visualizations to go along with the Pandas reshaping guide.
Pivot
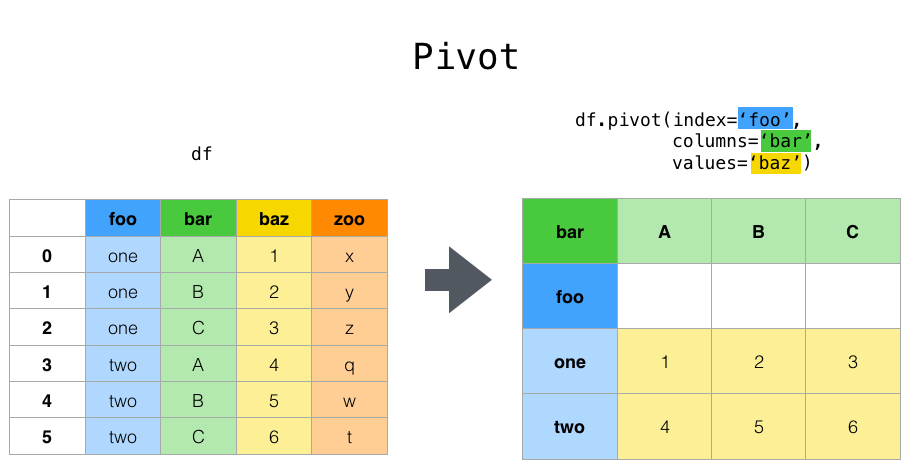
(Thanks to /u/Xylon- for the correction)
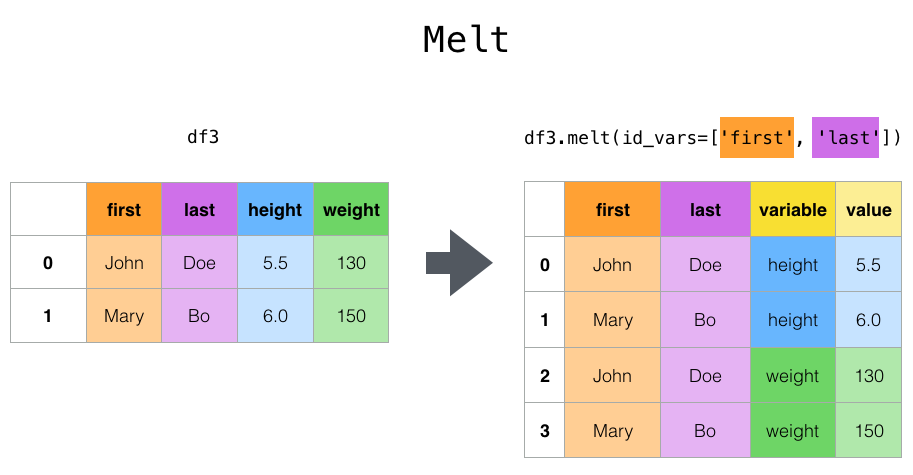
Melt
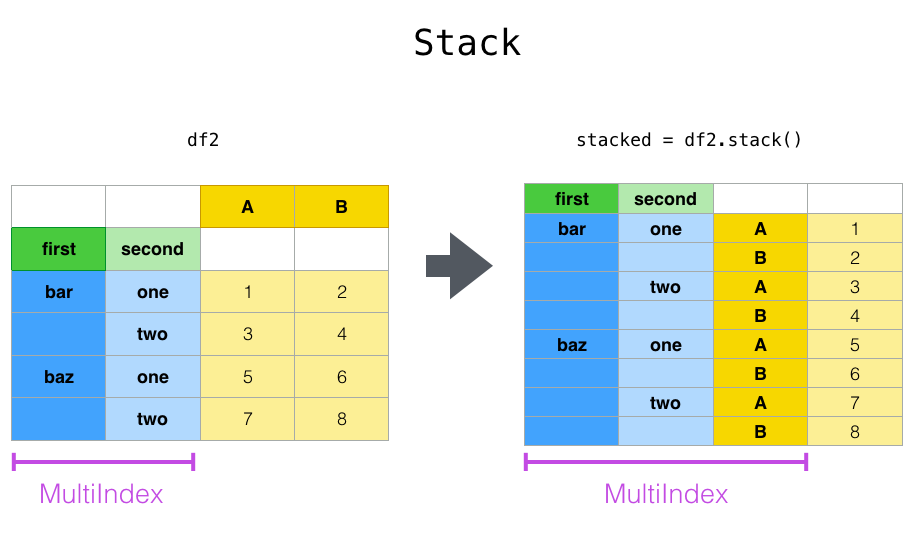
Stack
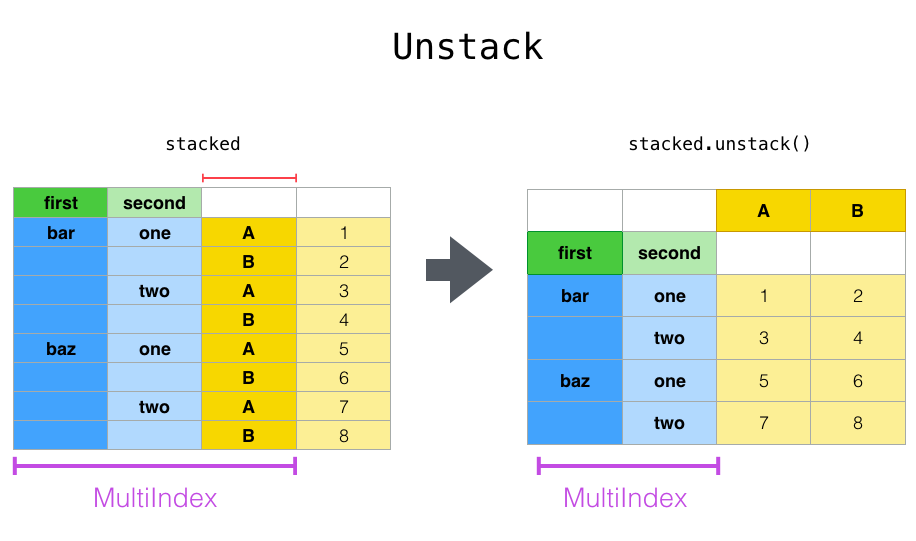
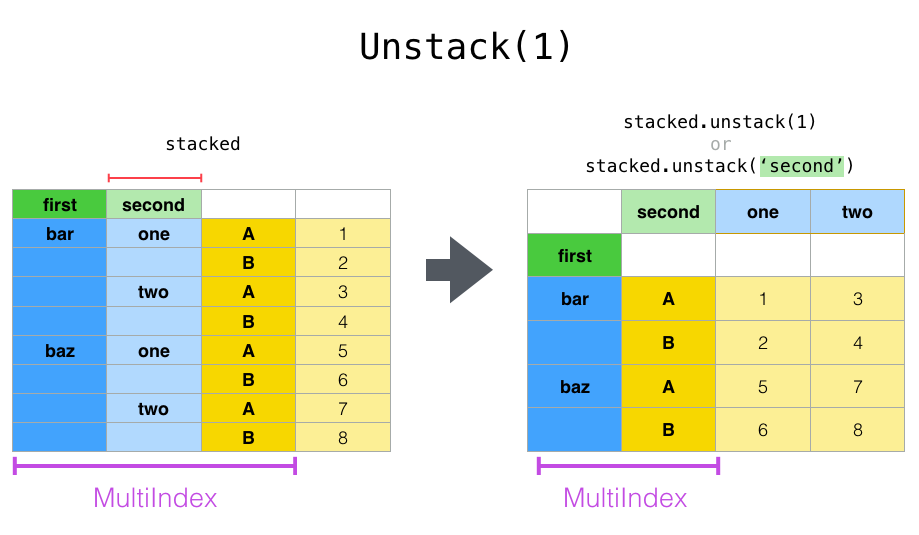
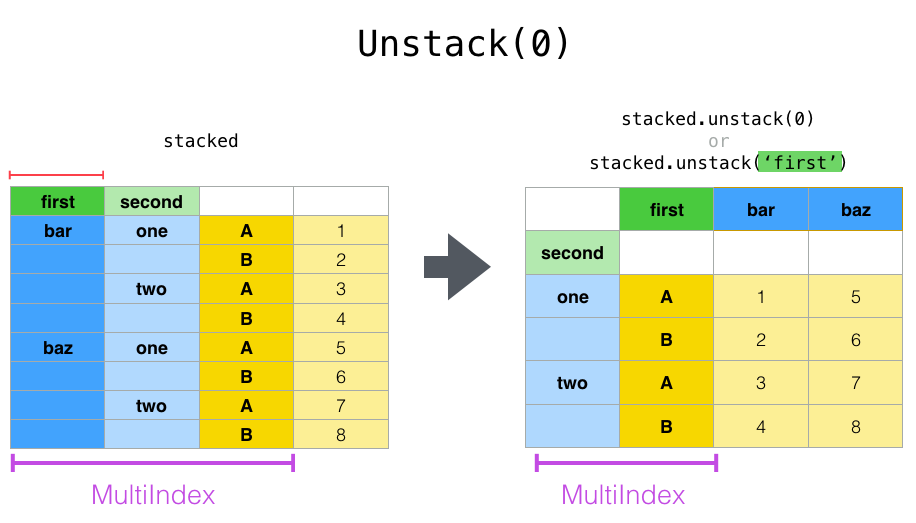
Unstack
Example #1 – without a parameter
Example #2
Example #3
Written on April 30, 2018
