A Gentle Visual Intro to Data Analysis in Python Using Pandas
Discussions: Hacker News (195 points, 51 comments), Reddit r/Python (140 points, 18 comments)
If you’re planning to learn data analysis, machine learning, or data science tools in python, you’re most likely going to be using the wonderful pandas library. Pandas is an open source library for data manipulation and analysis in python.
Loading Data
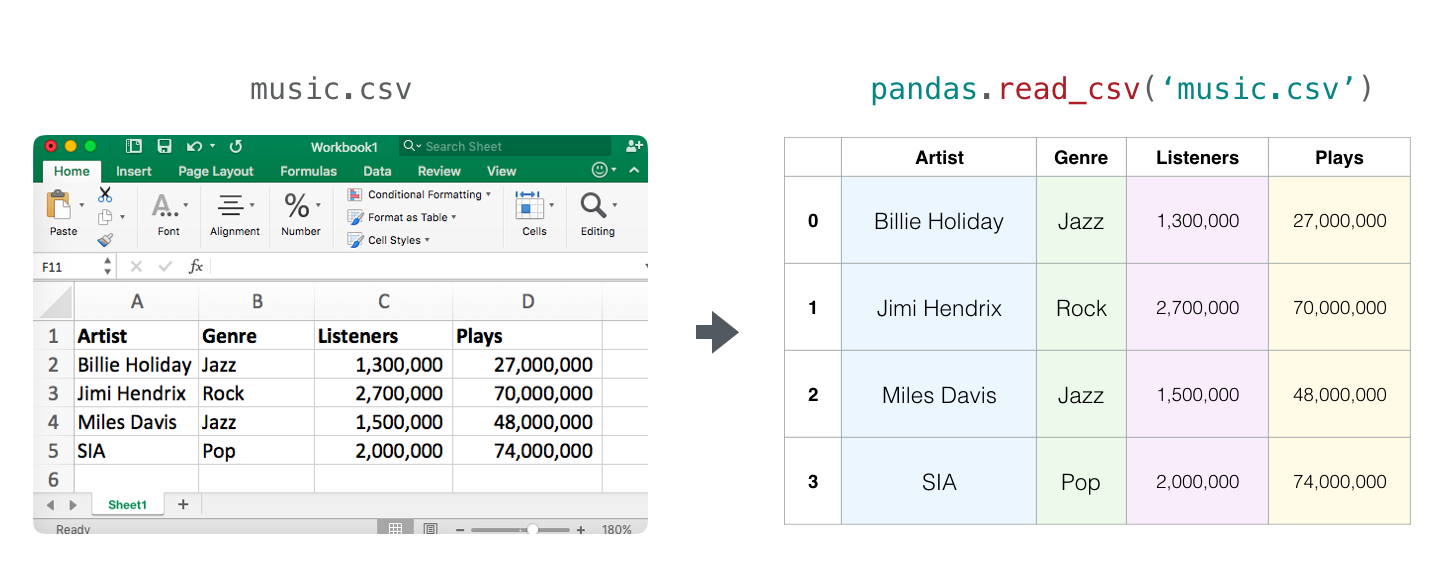
One of the easiest ways to think about that, is that you can load tables (and excel files) and then slice and dice them in multiple ways:

Pandas allows us to load a spreadsheet and manipulate it programmatically in python. The central concept in pandas is the type of object called a DataFrame – basically a table of values which has a label for each row and column. Let’s load this basic CSV file containing data from a music streaming service:
df = pandas.read_csv('music.csv')
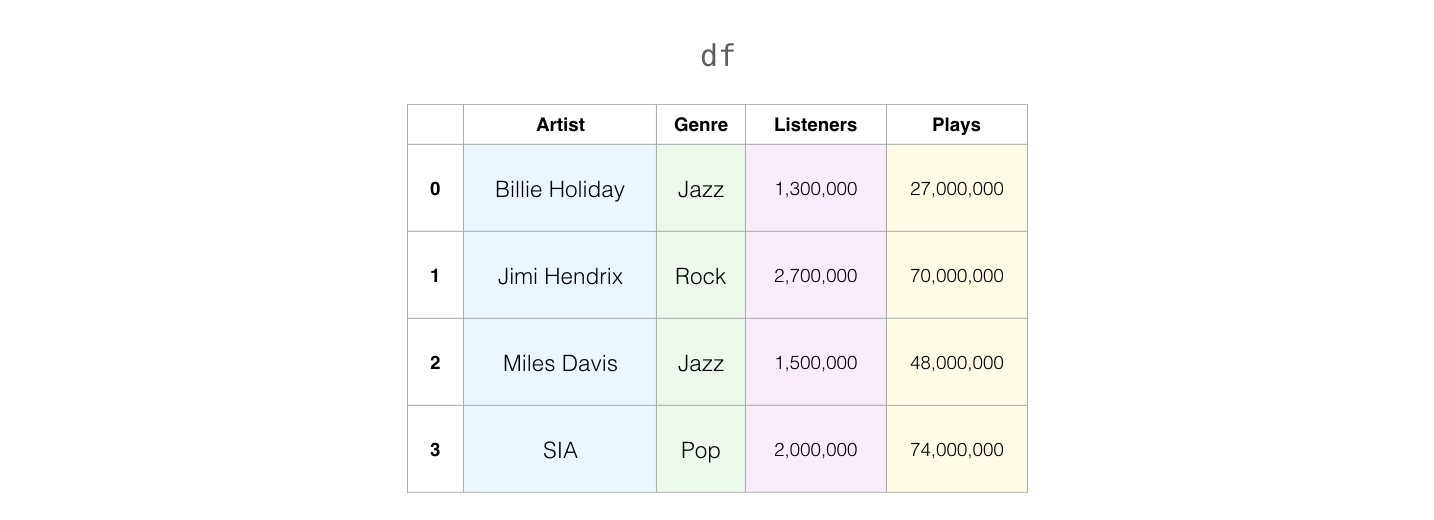
Now the variable df is a pandas DataFrame:

Selection
We can select any column using its label:

We can select one or multiple rows using their numbers:

We can select any slice of the table using a both column label and row numbers using loc (but here it would be inclusive of both bounding row numbers):

Filtering
Now it gets more interesting. We can easily filter rows using the values of a specific row. For example, here are our jazz musicians:

Here are the artists who have more than 1,800,000 listeners:

Dealing with Missing Values
Many datasets you’ll deal with in your data science journey will have missing values. Let’s say our data frame has a missing value:

Pandas provides multiple ways to deal with this. The easiest is to just drop rows with missing values:

Another way would be to fill-in the missing value using fillna() (with 0, for example).
Grouping
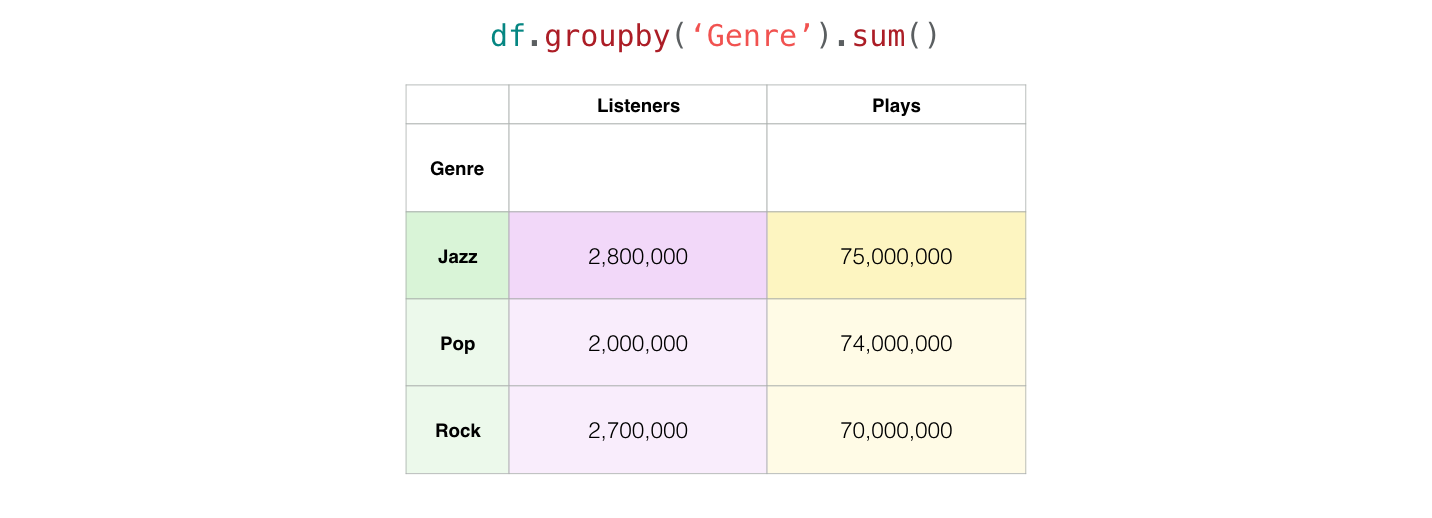
Things start to get really interesting when you start grouping rows with certain criteria and aggregating their data. For example, let’s group our dataset by genre and see how many listeners and plays each genre has:

Pandas grouped the the two “Jazz” rows into one, and since we used sum() for aggregation, it added together the listeners and plays for the two Jazz artists and shows the sums in the combined Jazz column.
This is not only nifty, but is an extremely powerful data analysis method. Now that you know groupby(), you wield immense power to fold datasets and uncover insights from them. Aggregation is the first pillar of statistical wisdom, and so is one of the foundational tools of statistics.
In addition to sum(), pandas provides multiple aggregation functions including mean() to compute the average value, min(), max(), and multiple other functions. More on groupyby() in the Group By User Guide.
If you use groupby() to its full potential, and use nothing else in pandas, then you’d be putting pandas to great use. But the library can still offer you much, much more.
Creating New Columns from Existing Columns
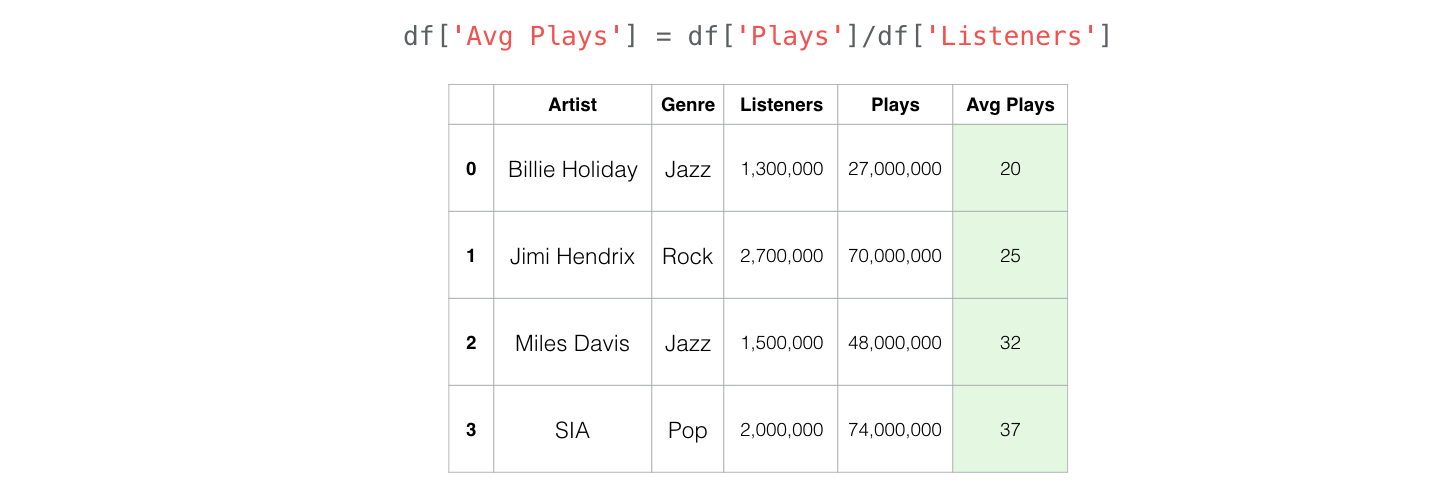
Often in the data analysis process, we find ourselves needing to create new columns from existing ones. Pandas makes this a breeze.

By telling Pandas to divide a column by another column, it realizes that we want to do is divide the individual values respectively (i.e. each row’s “Plays” value by that row’s “Listeners” value).
Get Hands On!
You can get started playing with Pandas in your browser right now through this basic notebook hosted in Google Colab. The notebook is also available on Github if you have your local environment set up.
Learn More Pandas
Want to learn more? Be sure to check out the 10 Minutes to pandas tutorial in the official Pandas docs. Thanks to Marc Garcia for initiating the thoughts for these visualizations and continuing to improve the pandas documentation.
Your feedback is appreciated!
Did you find this tutorial helpful? Any suggestions for improvement? Please let me know (@JayAlammar) know on Twitter. Thanks!
